Topic 1: Exercises
You will work on Exercise 1 with Kristoffer in class. The exercise consists of the following parts, try to work on them in the order they are listed. It’s not important that you complete everything.
-
If you haven’t done so yet, please make sure you’ve completed this survey to give us an idea about your background
-
Make sure you have R installed and are able to complete the following code
x = 5
y = 10
x * y
## [1] 50my.missing.object = NA
my.number = 220
z = "we're working on exercise 1"
p = TRUEI want you to think about the following and then run the commands to see whether you were correct
- What kind of object is
z - What happens if we run
my.number * z? - What happens if we run
my.missing.object * my.number? - What kind of object is
p? - What is the outut of
my.missing.object == NA? why do you think this is?
- Working with data.
Try to read the following dataset
library("readr")
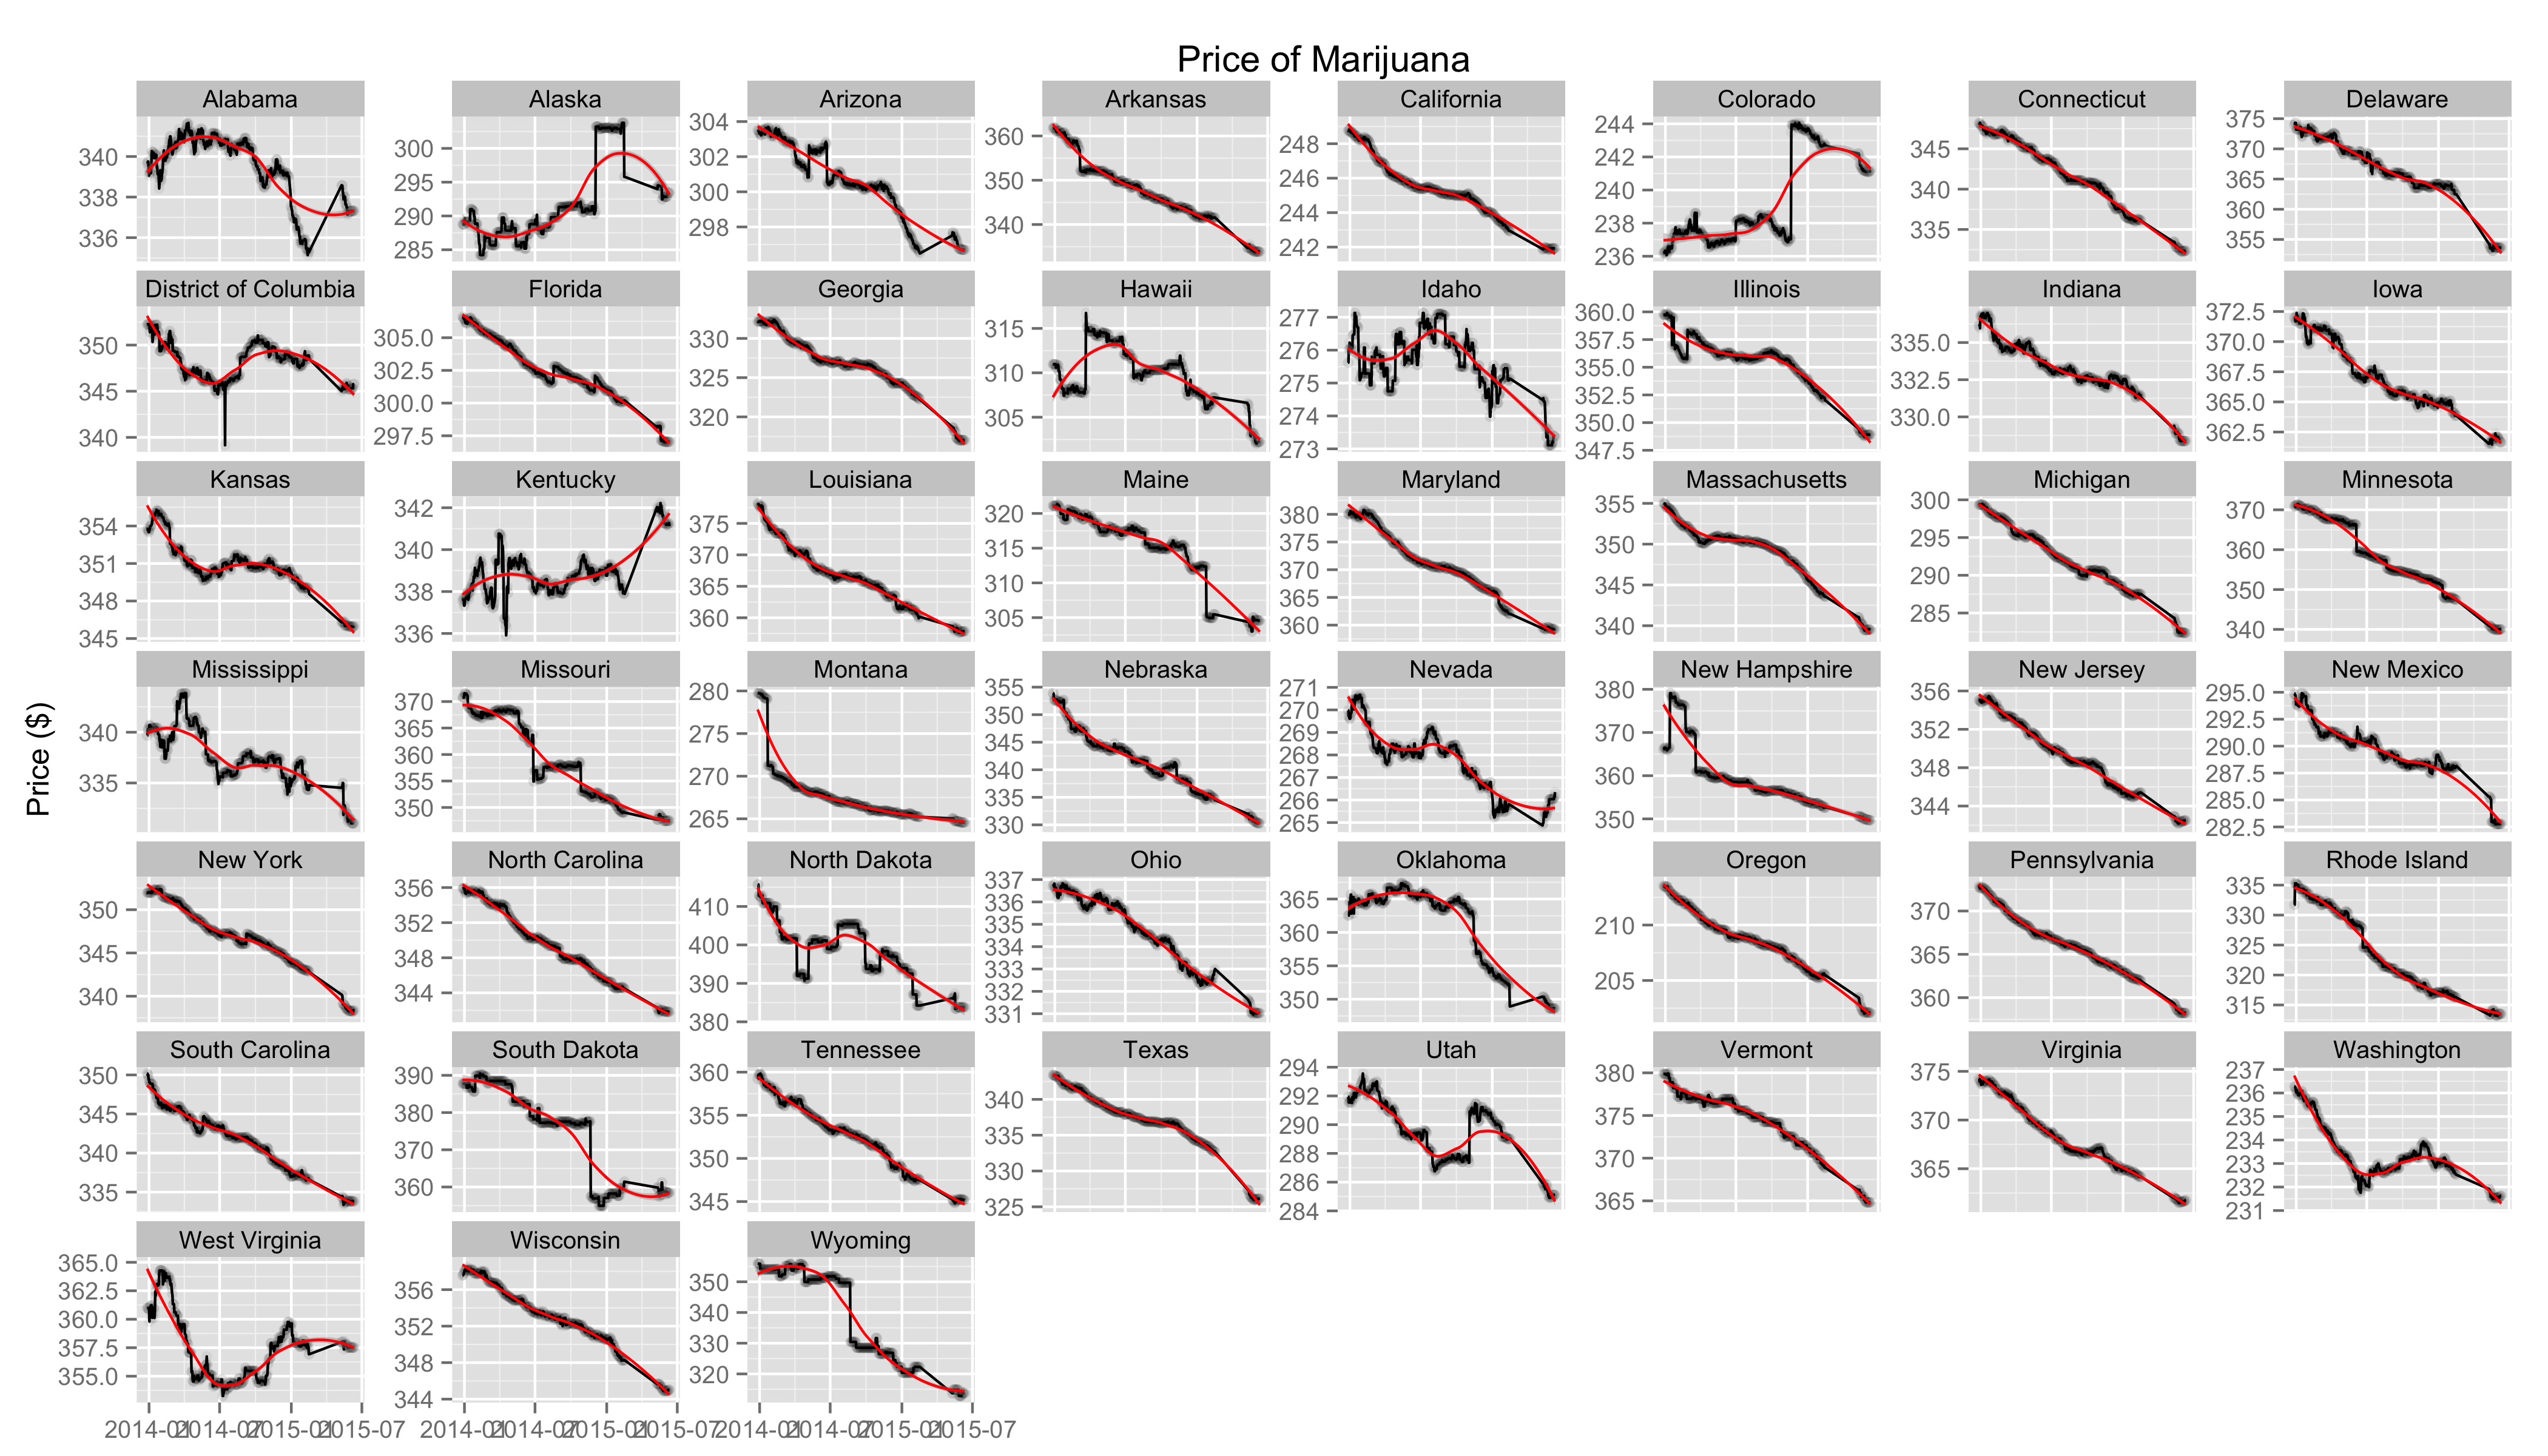
my.df = read_csv("https://raw.githubusercontent.com/sebastianbarfort/sds/master/data/marijuana-street-price-clean.csv")This is a dataset of daily marijuana prices across the U.S. The data is scraped from priceofweed. We will talk later about how to do this. The idea behind the website is to crowdsource the price of marijuana
We crowdsource the street value of marijuana from the most accurate source possible: you, the consumer. Help by anonymously submitting data on the latest transaction you’ve made.
You should know that variables ending with QN counts quantity and Q lists the price. There are three classes of marijuana quality listed in the dataset: High, Med and Low.
-
first, try to describe the dataset. What simple commands would you run?
-
second, I want you to think about pros and cons of using this kind of data? What should we be worried about when working with this kind of data?
-
third, think about interesting questions to ask from the data?
-
fourth, to test your R skills, try to answer the following questions
- what are the dimensions of the data?
- what are the class of each column?
- which state has the highest mean marijuana price?
- fifth, if you have time, look at the documentation for
ggplot2(run?ggplot) and try to create some interesting plots. An example is given below.